In Part 1 of two posts, I tackle a controversial topic: problems with the Kano Model. (+credit to my colleague Mario Callegaro, who partnered on the research and analysis. These posts are my summary of the work with Mario.) As always, if you disagree with my conclusions, that's OK. My goal — as with topics in the Quant UX book — is to provoke UXRs to think. We shouldn't simply go along with methods we see, especially from non-specialists (and it's great to be skeptical of this blog, too).
What is Kano? The Kano Model is said to "help teams determine which features will satisfy and even delight customers. Product managers often use the Kano Model to prioritize potential new features by grouping them into categories. These feature categories can range from those that could disappoint customers to those likely to satisfy or even delight customers." (from productplan.com).
The Kano Model is popular because it promises to deliver something incredibly valuable: a glimpse of the future success of a product, at the very low cost of just two questions on a consumer survey.
I won't repeat the details of the Kano Model (see here for a complete guide) except to note briefly that it is typically implemented as follows. First, respondents are asked two survey items about each feature or service being considered. Based on the answers, the features are sorted into whether respondents view them as being must-have, performance, attracting, unappealing, or indifferent (these terms vary). Finally, the results are plotted to compare which features should be prioritized highly (must-have, attracting), moderately with trade-offs (performance) or not prioritized (indifferent, unappealing).
Unfortunately, there is little evidence to support the Kano Model (I'll say more about that literature in Part 2). But there are several reasons to be skeptical as well as evidence that challenges it.
The Kano Model is appealing because it answers important questions, is easy to implement, and the results lead to good discussions with stakeholders. But the answers are quite probably wrong. My coauthor Mario Callegaro and I have written about this in detail (whitepaper; slides). Thanks to the Analytics & Insights Summit (formerly known as the Sawtooth Software Conference) for inviting us to present this at the 2022 Conference!
Following are two reasons why I am skeptical of the Kano method. I'll discuss additional reasons in a forthcoming Part 2 post.
Issue 1: The Survey Items are Poor
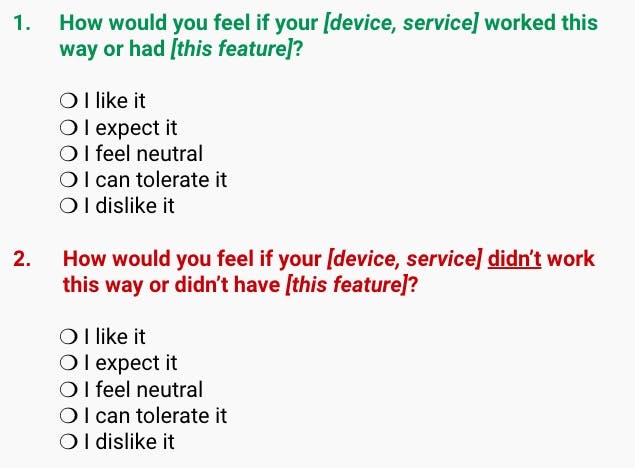
The standard Kano Model asks two questions for any particular feature or service:

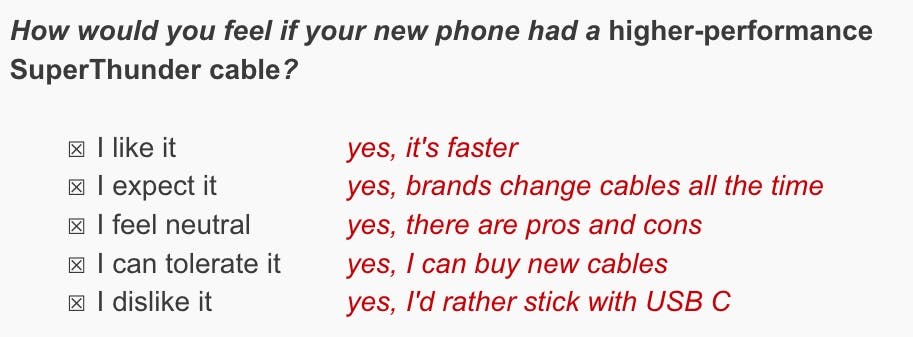
The responses are converted to a dimension rating by assigning numeric values. I'll skip the details and instead point out that these response options do not form a dimensional scale. They are not even mutually exclusive!
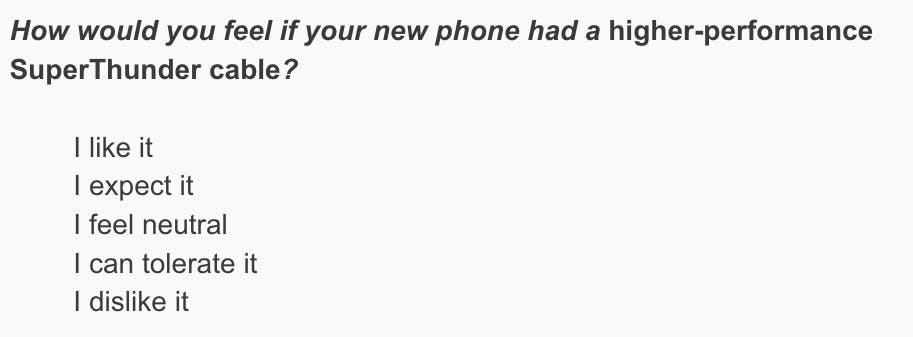
Why not? Consider this example. Suppose our survey describes a new smartphone charging feature — a "SuperThunder" cable — and asks respondents:

Although respondents are forced to choose a single response, it is perfectly reasonable that they might agree with all five choices simultaneously! For example:

This scale is a poor response set, further implemented poorly by requiring single responses. As we'll see in Part 2, this leads to unreliable data. (In the whitepaper we note that the items suffer from other problems, such as hypothetical and counterfactual biases, a multifactorial structure, and acquiescence bias.)
As an aside, this kind of nonsense scale will be noticed immediately when a survey is pre-tested live*.* In a live pre-test, a few respondents talk aloud about survey items. I suspect that Kano questionnaires are rarely pre-tested.
Instead of the Kano scale, use high-quality survey items that do not conflate multiple, independent dimensions. (Note: if you use a different scale, you can't use the Kano Model scoring system. IMO that's OK because there are better alternatives, as we'll see in Part 2. And no scoring procedure will rescue an unreliable scale.)
Are you wondering, "that's just theory, what if it really works?" First of all, this reflects magical thinking, hoping that something non-sensical will work in practice. Second, there's more to say about the theory, and we'll see empirical data in Part 2.
Issue 2: The Theory is Suspect
For stakeholders, an especially salient claim of the Kano Model is that it can distinguish whether a feature is a must-have feature (expected but not exciting), a performance feature (preferred but not necessarily required), or an attracting feature (a positive surprise). This is often phrased in terms of figuring out whether an offering will be "delightful," which is assumed to be similar to an attracting feature.
Based on work by Kano and others in the 1970s and 1980s, these categories were conceived in the context of mature, durable consumer goods (consider toaster ovens, sofas, watches, and automobiles). Such goods change slowly in their functionality and are understood well by consumers. In those categories, substantially new features are rare but when they arise, they are relatively easy for consumers to understand and judge. The Kano Model categories may be a good fit for such products (which doesn't overcome the survey issues noted above).
However, the Kano categories are highly questionable in product categories that evolve quickly, show continual improvement, offer radically new features, or whose features are difficult to understand or judge before experiencing them. That includes many tech industry products.
Consider three common examples from tech products: faster processor speed, higher quality images, and longer battery life. In the Kano framework, those might be expected to be performance features. "More" is better but there is no strict minimum requirement.
However, for tech products, performance is expected to always increase. Every new computer is assumed to be faster; every new phone or camera should have better image quality; and every new electric product (car, bike, etc.) should offer longer battery life and/or higher power performance. Thus, for tech products, performance enhancement is expected and is a must-have.

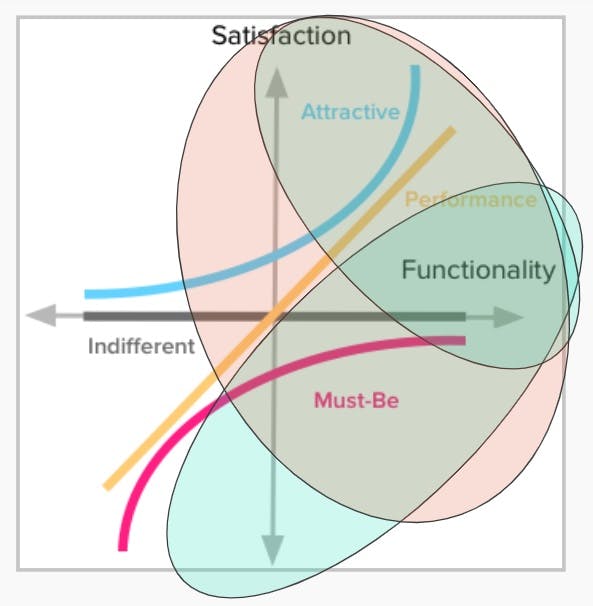
At the same time, many consumers purchase such products exactly to get the performance benefits and are often surprised by them. Their new TV is brighter, larger, and cheaper than they expected; their new laptop is surprisingly fast; their new phone takes better photos with easier and more useful editing. Thus, for tech product performance enhancement is attracting and surprising, and also performant, and also a must-have. They overlap tremendously.

In categories where products show continual improvement, such as tech, the Kano Model breaks down — any given feature can reasonably appear in several categories. It will depend on the vagaries of how respondents view it, whether they understand the use case ... and how they understand the survey scale. Regardless of customer perceptions, the categories of performance, attracting, and must-have are highly overlapping and often indistinguishable for tech products, and other categories that show continual improvement.
So, it would be better to prioritize features in other ways ...
... but for that, stay tuned for Part 2. In that post, I'll share empirical data, other concerns, and recommended alternatives (Can't wait? See Chapman & Callegaro below).
References
The ideas and survey illustrations in this post are from:
C Chapman and M Callegaro (May 2022). Kano analysis: A critical survey science review (whitepaper; presentation). Proceedings of the 2022 Sawtooth Software Conference, Orlando, FL.
The original Kano paper (in Japanese) is:
N Kano, N Seraku, F Takahashi, and S Tsuji. (1984) Attractive Quality and Must-Be Quality. Journal of the Japanese Society for Quality Control, 14, 147-156.
A popular guide to applied Kano analysis, and the survey items and scoring, is:
D Zacarias (2015). The Complete Guide to the Kano Model. Online, https://www.career.pm/briefings/kano-model

