A common type of data Quant UXRs encounter is counts (frequencies). This post shows a simple but real example, demonstrating how I explore and analyze such data.
First of all, what are counts data? They are positive integers (including zero) that count how many times something happens, or how often something appears in a data set. Examples include how many units of a product are sold, the population of a city, the number of clicks on an ad, the number of people with PhDs in a conference audience ... the observed frequency of anything you might wish to count.
From a statistical point of view, counts have a few properties that affect our analyses. First, they cannot be negative. So a model that allows negative values (looking at you, generic linear regression) is inappropriate. Second, counts are integers, not continuous/real numbers. Third, counts typically follow a power law distribution, where small values are much more common than higher values.
In this post, I look at the number of views of my blog posts. In a forthcoming Part 2 post, I'll analyze the number of attendees at Quant UX Con.
In these posts, my goal is not to give a comprehensive account, but rather to demonstrate and walk through my process and thinking. I hope that a practical, applied demonstration will help other UX researchers more than a statistics article would. As usual, I share R code for all of the analyses as I go, and compile it in one place at the end of the post.
Views of Blog Posts
This is a very small and simple set of observed counts (frequencies). Let's see how much we can extract from it. I'll share the code for each step. (As a reminder, you can click the "copy" icon in the top right of any code snippet and paste it into RStudio or some other editor.)
The data is a series of 20 counts for how many times my blog entries (this blog) have been viewed, as of a week ago:
# number of Quant UX blog views per post, as of 11/09/23
views <- c(229, 175, 125, 637, 264, 1030, 438, 549, 50, 402, 963, 245, 149, 67,
           343, 86,  245, 103, 234, 98)
I always look at a summary() of the data:
summary(views)
That is:
Min. 1st Qu. Median Mean 3rd Qu. Max.
50.0 19.5 239.5 321.6 411.0 1030.0
This starts to reveal one problem, which is that counts tend to have a long tail (a few large observations). The mean is quite a bit larger than the median, and the max is much farther from the median than the min.
Often, a good transformation for counts data is a log() transform. When you exponentiate the mean value of a log transformation, it is the geometric mean. Here's that:
exp(summary(log(views)))
The result:
Min. 1st Qu. Median Mean 3rd Qu. Max.
50.0 119.1 239.4 229.8 410.7 1030.0
Using the geometric mean, the mean and the median are substantially closer together. That tells us that the data might be more symmetric in log values than in raw values. Note that all of the other values are unchanged after doing exp(log()), compared to the raw summary() above, because they are point observations. Only a computation like mean() changes under the transformation. (Technical note: for count distributions, the mean and median generally do not converge exactly. The point here is that massive differences are one sign of skew in the data. More in a moment.)
We can examine the distributions of the raw and log values using two density plots; the two plots are shown after the code block:
plot(density(views))
plot(density(log(views)))
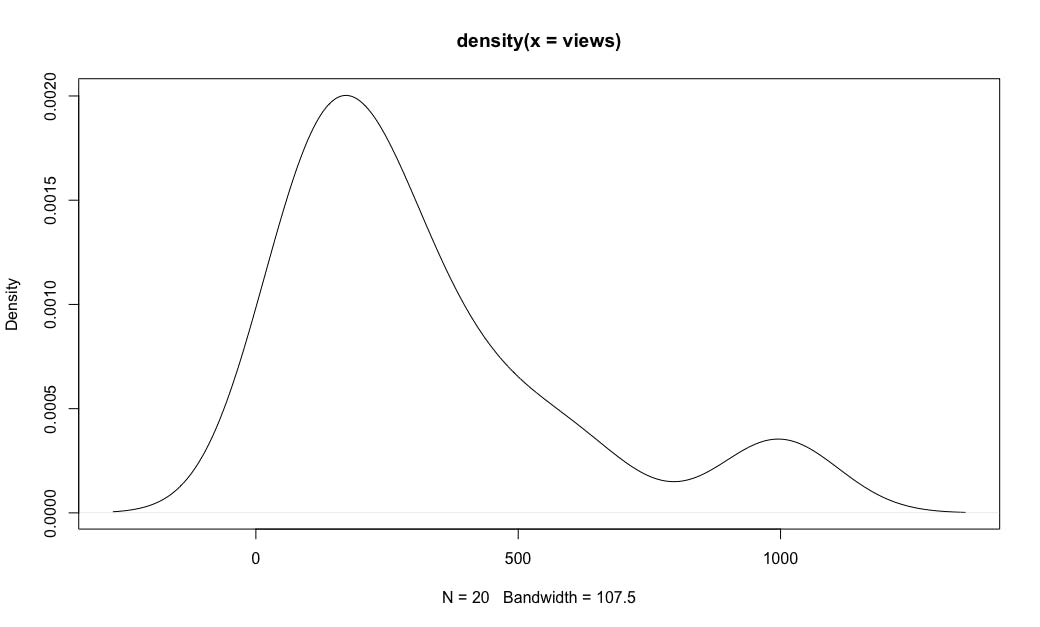
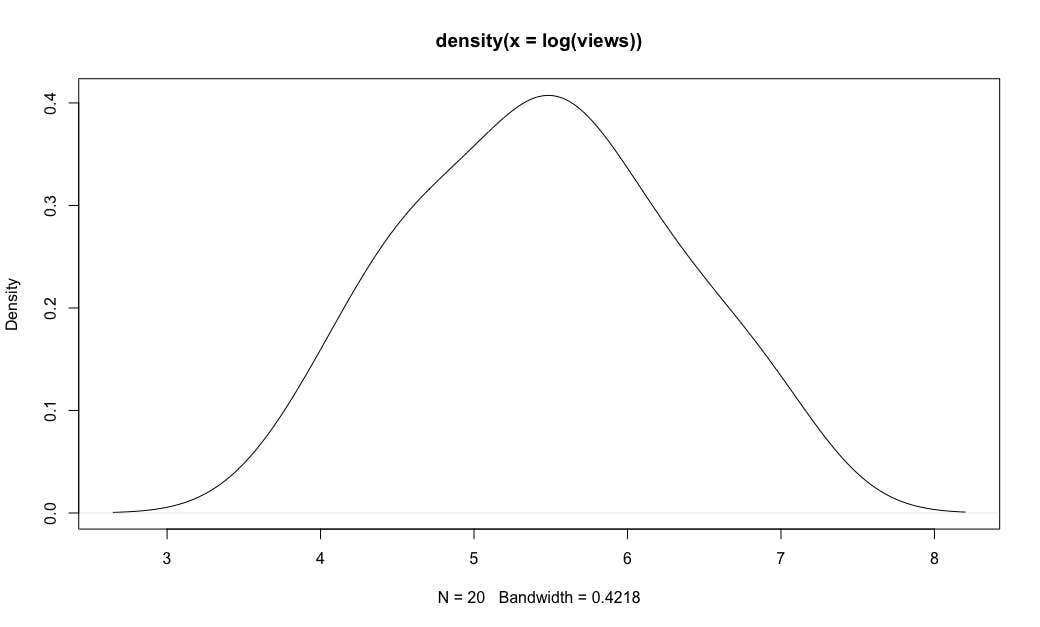
Aha! When the counts are transformed with a log() transformation, the distribution is very close to a normal distribution, as shown in the second plot. That is common for counts data. (Technical note: this is not exactly a log-normal distribution, as count distributions have somewhat different variances, such as higher peaks and/or longer tails. We'll see more later and in Part 2. For now, the key point is that a log() transform is useful and is much closer to normal, serving as a good approximation for many purposes. BTW, I don't recommend transforming the data, but rather using an appropriate transformation as part of the model or visualization.)
Counts over Time: Regression
For blog posts, we might wonder how much effect time has on the number of views. One possibility is that a post will accumulate more views over time, as readers look back at older posts. In that case, newer posts would have counts that appear to go down over time (compared to older posts). Another possibility is that the number of views would stay relatively constant over time if readers only look at the current post. It's also possible that views could go up over time if the posts are read at a constant rate while the reader base is growing in size.
In this case, our data set doesn't have the dates. However, my posts are written at a somewhat consistent rate, so we can simulate a time variable using a simple sequence, adding it to the views in a new data frame:
views.ts <- data.frame(Post=1:length(views), Views=views)
We'll plot the views by time and add a simple (naive) regression line. I'll say more about regression in a moment, but meanwhile that initial, naive plot is:
plot(views.ts$Post, views.ts$Views)
# add simple (naive) regression line
abline(lm(Views ~ Post, data=views.ts))
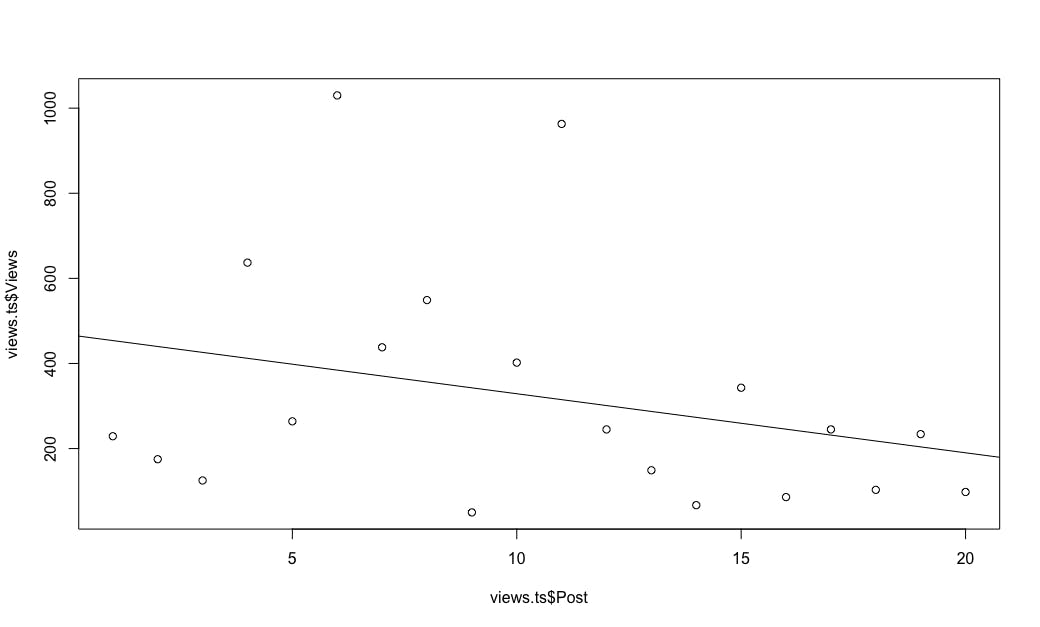
Both from the line and generally eyeballing the chart, it certainly looks as if the number of views decreases over time ... which is to say, that the views go up for older posts over time.
Side note: When reporting such data, be careful how you communicate it to stakeholders! "The views go down over time" sounds bad ... but "The views of older posts go up over time" sounds good! Even though the two statements are mathematically the same. If I were presenting this to stakeholders, I would reverse the time dimension so it shows the elapsed time since posting. Then the chart would go up! In R, that could be done simply by reversing the sequence I used, i.e., [20:1], or better by computing the elapsed time from a date variable.
So we appear to have a trend over time. Is it "significant"? I mentioned above that you shouldn't use generic linear regression with counts. The problem — as you can see in the regression plot immediately above — is that there are a few observations with extremely high values (the long tail of the distribution that we saw above), and those skew the regression model.
The solution is to use a regression model that is appropriate for counts. That gets into a complex field because it depends on whether you want to model zero as a possible outcome. For now, I'll just say that a Poisson distribution is the first choice for non-zero counts data, as we have here. (BTW, "Poisson" is capitalized because it is named after the prolific French mathematician Siméon Poisson.)
Poisson (counts) regression is available in R in the glm() (generalized linear model) function as follows:
summary(glm(Views ~ Post, data=views.ts, family="poisson"))
In this code, I model the number of Views as a function of the Post sequence (quasi-time), and fit the model with a Poisson distribution. Here's the resulting summary() of the model:
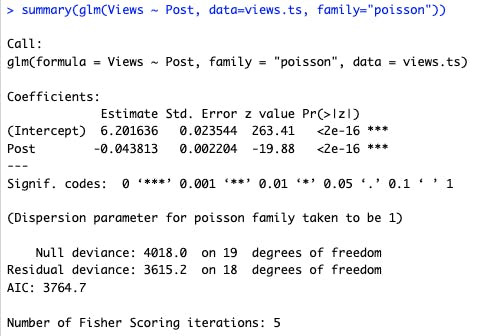
We can interpret the two coefficients as follows. First, Poisson regression coefficients are log-scaled values on the natural log scale, so they can be exponentiated with exp() to get raw values (i.e., estimated counts). In the regression summary above, we see that the intercept (the time 0 "average" starting point) is 6.20, so that translates to exp(6.20) or 493 views expected on average.
Second, there is a significant trend downward over time, as the coefficient for the Post sequence is negative. Expressed better, there is a significant trend of older posts getting more and more views over time. Each incremental time difference in our data adds exp(0.0438) or 1 view. In other words, each new blog post brings an average of 1 new viewer to every one of the older posts.
Conclusion (and stay tuned for Part 2)
I'll note something impressive: based on nothing more than a series of 20 observed counts, we have extracted a lot of information. We saw that the blog readership follows a predictable pattern that is consistent with a power-law (log transform) distribution, we fit a regression model using the Poisson distribution, and that showed a statistically significant trend that older posts gain views over time. That's quite a lot of insight from 20 integers!
If we were to analyze further, I'd want to add some variables to the data set beyond the raw counts. Some of those variables would include the actual date, as already mentioned, the number of subscribers at each point in time (that has been increasing), whether the post is known to have a one-time boost (such as my Kano analysis post being featured here), and perhaps some content tags such as whether the post is about R or careers. Those would improve analysis — but with just 20 observations they would also overfit the data that we have at this point.
In Part 2, coming soon, we'll analyze a somewhat larger data set, the number of attendees by country in the first two years of Quant UX Con. Stay tuned!
Learning More
The analysis of counts is a particular type of categorical data analysis (namely, category frequency). There is much more about working with categorical data in Sections 4.2, 5.2, and 9.2 of the R book; and Sections 5.2 and 8.2 of the Python book. The code here is additive to those texts — they don't go into regression for counts data, but explore several other topics.
For deeper statistical foundations, a comprehensive text is Agresti (2012), Categorical Data Analysis. Depending on your question and data set, there are other models besides the Poisson distribution that may be useful. The zero-inflated negative binomial distribution (ZINB) is an example — it models counts similarly to a Poisson model while estimating the rate of "0" counts separately. (But that gets away from the goals of this blog, and more into specialized statistical models. Hence the pointer!)
All the Code
Here is all of the R code from this post in one place. Best!
# Counts examples in R
# (c) 2023 Chris Chapman, quantuxblog.com
# Reuse is permitted with citation: Chapman, C (2023), Quant UX Blog.

# number of Quant UX blog views per post, as of 11/09/23
views <- c(229, 175, 125, 637, 264, 1030, 438, 549, 50, 402, 963, 245, 149, 67,
           343, 86,  245, 103, 234, 98)

# compare arithmetic to geometric mean
summary(views)
exp(summary(log(views)))

# raw vs. log-normal distribution
plot(density(views))
plot(density(log(views)))

# simple time series
# treats time as interval integers by post; date would be better
views.ts <- data.frame(Post=1:length(views), Views=views)
plot(views.ts$Post, views.ts$Views)

# add simple (naive) regression line
abline(lm(Views ~ Post, data=views.ts))

# regression model, using Poisson distribution
summary(glm(Views ~ Post, data=views.ts, family="poisson"))

