Favorite R packages, Part 1
I'm often asked which R packages are my favorites, or which ones a Quant UXR should know. The answer is — wait for it — "it depends." It depends on the data you have, the analyses you need, your team infrastructure, and how you code. Some that come to mind for me are ggplot2, MCMCpack, brms, lavaan, and superheat, among others. I also highly recommend data.table.
However, that list involves my stated preferences, and those may reflect aspiration or memory rather than real usage. An empirical, revealed preference could report the packages I use.
To find out, I wrote code to count the packages used in my R files. It counts the packages invoked by library() and (rarely) require() in the *.R files in my user folder. (I share the R code itself in a Part 2 post.)
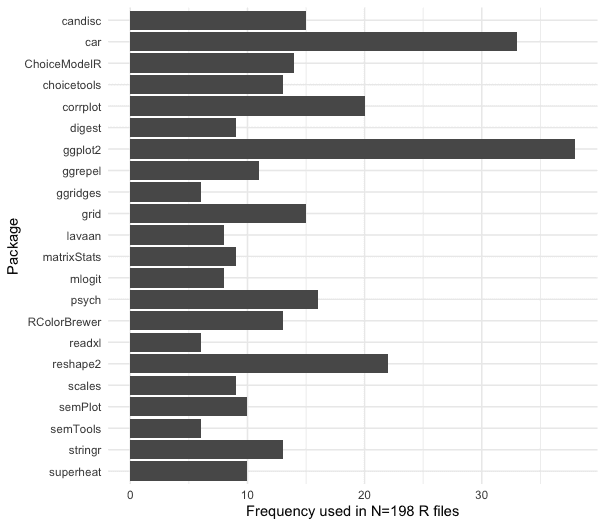
Here are the results. In my set of 198 .R code files, the packages I used 6 or more times are shown in this plot:

I'll comment on the top 5:
You probably know
ggplot2. I knew it would be #1 — it's the primary package I use for almost all charts.The
carpackage is a favorite for thesome()function, a routine part of data inspection for me. It's likehead()andtail(), except for random rows.I use
reshape2to prepare data sets forggplot2bymelt()-ing them.I'm surprised by
corrplotin fourth place although it is a nice, flexible way to inspect correlation matrices. I make more of those than I thought.Rounding out the top 5, I use
psychfordescribe(), a highly upgraded version ofsummary(), and sometimes also for factor analysis.
Beyond those, the list reflects my interests in choice modeling and conjoint analysis (ChoiceModelR, choicetools, mlogit), psychometrics (lavaan, semPlot, semTools), multidimensional analysis (candisc, superheat), and data visualization (ggrepel, ggridges, RColorBrewer, scales).
This chart shows 22 packages that appear 6 times or more (3% or more of my 198 .R files). On the long list — packages that appear at least once — it's a total of 97 packages. That's roughly 1 unique package for every 2 .R files. That is a lot, although it is a fraction of all packages in R (nearly 20000 on CRAN).
There are surprises. The biggest surprise is this: although I knew it would be #1*,* ggplot2 only appears in about 20% of my R files. I would have guessed 60%! There are two reasons:
I have written many more small, single-purpose R files that I realized (this gets to the "memory" point about stated preferences being inaccurate)
Although I remember code files that do "big and important" work — and those always make charts using
ggplot2— I forget the many secondary files that do clean and simulate data, or have "helper" functions. Those files do not make charts and they use few packages.
I'm also surprised by the frequency of candisc and a few packages whose use I don't recall (grid, plus others on the long list). Mostly, though, I'm surprised by the overall low frequencies for each package, and how long the long tail is.
Another surprise is how many of my .R files use zero libraries: 39% (77/198) use zero packages.
How about tidyverse? As noted in the R book, it is a complex overlay to base R. For various reasons (especially code stability over time), I tend to use base R in general and tidyverse selectively (e.g., ggplot2 and reshape2). That reflects my coding approach to R, as opposed to interactive analysis; neither is right or wrong, just another example of "it depends."
Why not simply list the installed packages? That would be another source of revealed preference. Using str(installed.packages()), I have 217 packages. However, many of those packages come with R, or they are installed with other packages regardless of whether I use the dependencies. (One might trace which ones are used; that involves code far beyond our scope here.)
What does this suggest for other Quant UXRs?
Learn
ggplot2andreshape2! (And I recommendcar::some().)If you work with surveys and psychometrics, or any correlated data, check out
psychandcorrplot.Expect to use many new packages over time; invest time to review and explore them. On average, I use a new package in every 2nd
.Rfile.Check your code files for the packages you use (coming soon). I'll publish the code for this post in an upcoming Part 2.
There is a higher-order research takeaway: even a simple question like, "which R packages are your favorite?" can be answered in different and conflicting ways. A good researcher will probe and clarify a question before jumping ahead to an answer.
If you'd like to see examples of how I use many of these packages, check out the [free] code files for my R book with coauthor Elea Feit. Those files are, in fact, key resources for me — I begin many projects by copying one of the
.Rfiles from the book. Appendix D in the book has an annotated list of the packages used and why we use them.
A big question in R is, how can someone sort through all of these packages? It is difficult to determine which package has something you need; whether it will work for your problem; and whether you can trust it. We say more about that in the R book, but my general recommendations are: (1) use trusted references like published books or recognized online authors; (2) look for packages that have been around for a while; (3) read included vignettes (basically, whitepapers) that describe a package in detail. The R function vignette() will list these for installed packages; or find them in CRAN package indexes. And (4) invest time and do not expect to find a package for any last-minute need.
Apart from tidyverse and data.table, are there packages that you use regularly and recommend? Comments are open!