Stakeholders always want to know how long a project will take.
Folks taking on Quant UXR projects may not have a good way to estimate project time, so I'll share my observations. This is not a comprehensive discussion; it is a short version of how I think about the question. I'll also use the opportunity to warn about things not to do!
As a preliminary matter, the discussions here are about "quantitative UX research" as Kerry Rodden and I define it in the Quant UX book:
Quantitative UX research is the application of empirical research methods to inform user-centered product design at scale. [p. 25]
In accordance with that, this post assumes that you will gather new or existing data, perform empirical analysis or statistical modeling, and share the results for product impact. Other tasks would differ in their heuristics for time estimation.
Unit == a Month
The first general rule is this: when planning project duration or discussing it with stakeholders, the unit of measurement is one month.
Thus, the simplest project is estimated to be 1 month in duration. For your own purposes — not to communicate with stakeholders — that might break down like this:
Week 1: Reconnaissance. Clarify the question and decision to be made. Investigate and plan data acquisition. Model data and proof-of-concept analyses.
Week 2: Foray. Gather and clean data. Preliminary modeling. Prepare to reboot the entire process if something fails. Refine the question and decision.
Week 3: Regroup. Do the analyses, put together the key insights. Review tentative directions and outcomes with a small set of trusted colleagues.
Week 4: Finalize. Revise and iterate analyses. Build out final deliverables.
Each stage poses failure points. It may be impossible to collect the data you need. You might obtain data but the quality makes it unusable. The anticipated analyses may fail to work or may yield uninterpretable or ambivalent results. And stakeholders may pose unanticipated questions that require substantial reworking.
Crucially, the one month timeline assumes that the question(s) and decision(s) are clear and are suitable for a one-shot answer. If they are not clear, are exploratory, need iteration, or have no specified decision to inform, then the process will be longer (if it should even be done at all). I discuss that in the next section.

(Photo:Towfiqu Barbhuiya on Unsplash)
By thinking in units of a month, you build in enough flexibility to recover from one or two significant road blocks. For example, switching to a new statistical method or a new set of data may be accomplished in a matter of days (depending on the details). Or, if everything goes according to plan, you will be able to deliver more polished results — and perhaps even early results!
As a practical matter, this provides a default response for many situations:
Q: How long will it take for ___ ?
A: A month.
A Big Project == Several Projects == Several Months
The second rule is this: when a question involves complex, long-term, or strategic decisions, think of it as multiple projects occurring in overlapping succession. Each part may be estimated as a one month project on its own.
Three examples of this are: (1) developing user segments or profiles; (2) first-time conjoint analysis in a new product space (see this post); (3) developing a validated survey scale (see this post).
Let's look at the first example. Why would user segments require several iterated months of time? Many stakeholders (and too many analysts) assume that a segmentation project involves simply applying a clustering method to existing data to uncover segments. They expect that will be a one-shot, relatively quick project.
There are so many incorrect assumptions in that sentence that I might write a whole chapter on it. (See Chapter 11 [10] in the R [Python] book!) The three most important reasons are these: (1) you are unlikely to have the right data and will need to collect it; (2) there is no guarantee that you'll find segments; most human data is quasi-continuous, not crisply categorical, and is sparse in multidimensional space; (3) even if you find segments, there is no guarantee they will be useful. Iteration is required to refine the data, the analyses, and the results. (BTW, there is a corollary: one-shot segmentation projects are unlikely to be correct or useful.)
I think of such projects with what software engineers call an "iterative waterfall" model. In that model, there are discrete steps that feed forward one at a time (thus, "waterfall"). At the same time, any project may also be set back and require revisiting previous steps (and thus is "iterative"). That might mean backing up to the immediately preceding step ... or all the way back to project inception.
Here's a chart that illustrates an iterative waterfall for data analytic projects. The solid lines represent the expected step-by-step flow. The dashed and dotted lines signify that there is always a chance of needing to backtrack to any previous step.
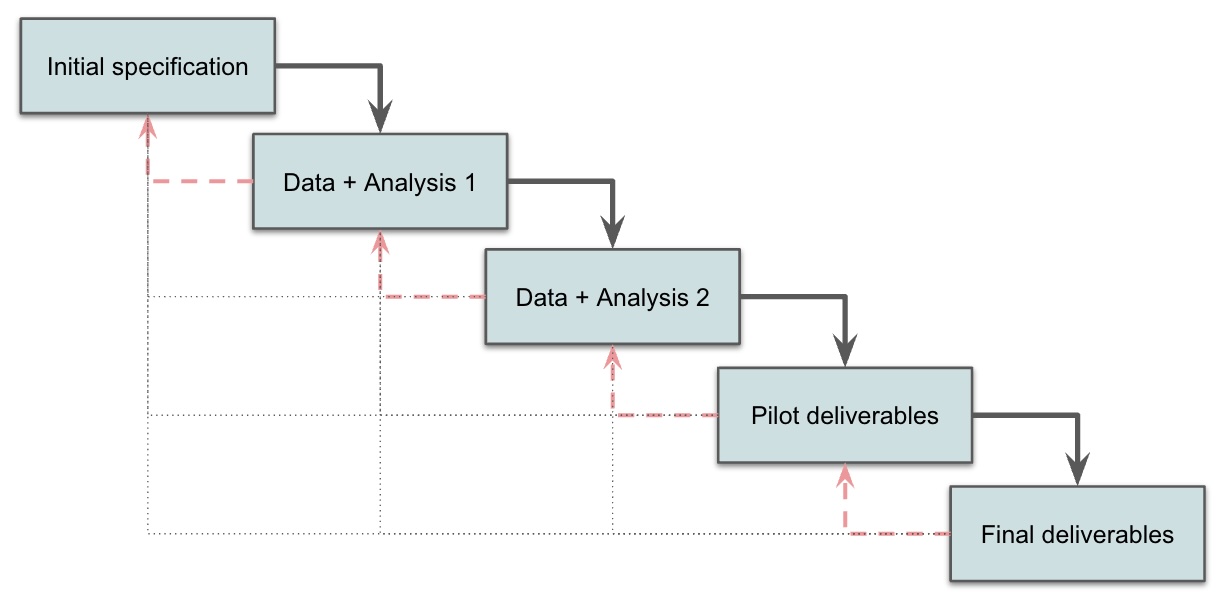
This chart shows 2 waves of data and analysis. Additional waves of data collection or analysis might be required for a given project, and often they are unknown in advance. Each significant chunk adds 1 month on top of the 1 month baseline. Reading the chart above, where I expect 2 rounds of data and analysis, I would generally propose a 3 month timeline: one month for the baseline scoping and deliverables, plus one month for each of the two data+analysis rounds.
Story: years ago, I led a project to find user segments in three product lines concurrently. We sought an "overall" model to apply to all 3 products, plus individual segments for each product: a total of 4 models, where 1 hierarchical model encompassed the other 3. It was also international in 3 languages.
I counted that as 5 "projects" total (4 models plus internationalization), and — as discussed above —estimated 6 months for it. [TBH, that was conservatively estimated, to give room to negotiate and/or deliver ahead of schedule.]
When a key executive reviewed the plan, the first comment was, "What?! All you have to do is run a segmentation study. A study should take 2 or 3 weeks!"
In the end, the project took about 5 months. Roughly 2 months of that was spent just to iterate on deliverables in order to address stakeholder feedback.
Bottom line: plan projects in units of months, and don't be shy about planning for iteration and surprises. If you deliver early, great! If not, you'll set expectations appropriately.
Or, as Star Trek Chief Engineer Scott put it, when he heard a low-end time estimate:

What About Quick Projects and Data Requests?
What if you have a request that you can answer quickly? Perhaps it simply involves slicing data that already exist, in a matter of minutes.
Well, in that case, answer it ... after considering the following questions:
Will the fast turnaround establish a pernicious expectation for future requests? Are you teaching-by-example that this is what to expect from research?
Are you encouraging the other person to focus on short-term questions?
Do they really need the answer for a decision, or is it just a random request?
Is it distracting you from other work?
Will it help build or maintain an important relationship with a colleague? Or are they not a good partner?
Do's and Don'ts in Time Estimation
DO: include at least 1-2 weeks or two to preview, share, and evangelize. A common mistake is to assume that a project is finished when the analysis report is finished. It's not! As any writer will tell you, one of the most important parts of writing is re-writing ... and the same is true of analytic deliverables. You should plan to preview, clarify, and have a plan to share out results.
Build in time for that. Don't just email results. Commonly, the underlying problem is said to be "throwing a report over the wall" ... at which point it will almost certainly become a "shelf report".
DO: use suppliers and/or contractors to accelerate. What if the time estimate here is too long? Answer: use suppliers to accelerate the work. A supplier may be able to bring a team to bear who already have expertise and can work in parallel. For example, on the segmentation project mentioned above, a vendor may be able to handle the multi-language translations, fielding, recruiting, and initial data cleaning.
OTOH, ramping up a supplier is itself a "project" ... and that means there is a fixed cost of — you guessed it — at least one month at the start. That may involve proposals, bids, reviews, negotiation, purchase order approval processes, legal approvals, accounting onboarding, and so forth. You will need to account for any anticipated acceleration after incurring those costs.
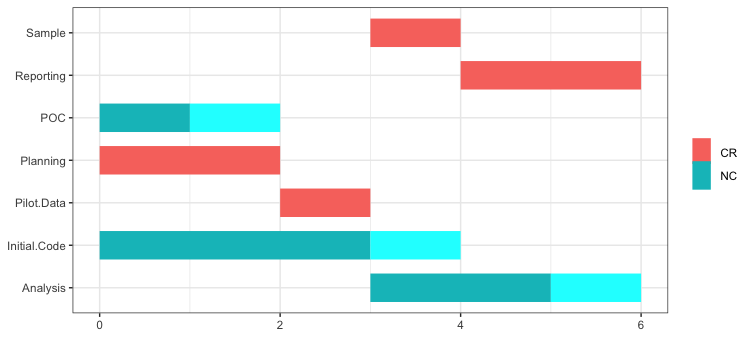
R bonus. Here's a very basic Gantt Chart for the steps that might occur in a "one month" Quant UX project. The "critical path" activities (according to the solution algorithm) are in red while other activities are teal. See the Appendix for the R code.
Do NOT: share the granular details of time estimates with stakeholders. Stakeholders may want to know what will take so long. If you go into the details of time estimates — such as the time needed to recruit respondents or write code or do statistical analysis — stakeholders will naturally engage you in negotiations to trim time from each of the stages.
But you are the expert and a key part of your job is to protect the project (and stakeholders) from overly aggressive schedules. Avoid that ... and if necessary, refer to standard expectations such as (for example) how long any survey project will takes to field.
Do NOT: deliver the same week (or day!) a project finishes. This is closely related to the first "Do" above, which is to build time for deliverables, but emphasizes a difference aspect: you will need time to consider the results, reflect on whether they are rational, and reconsider any possible problems.
Too often I see analysts share "the answer" — perhaps with all of the preview and revision steps noted above — only to discover later that the story doesn't really make sense, that there is a bug in the analysis, or a better approach. Just because you arrive at some answer doesn't mean it is the best answer. Build in time to think!
Do NOT: build a live dashboard. OK, I threw this in for provocation. I believe dashboards require a different skill set than doing research. Once you build a dashboard, you will become the "dashboard engineer" ... which turns into an ongoing time sink about reliability and uptime, not research.
That doesn't mean one should never deliver a dashboard, but rather that you must consider the sustained costs and opportunity costs very carefully. (For more, see Section 8.2.7 in the Quant UX book.)
For More
If you have the Quant UX book, see Chapter 13 for more about the expectations for working with stakeholders. When planning a project, be sure to consider the common stakeholder problems described in Section 13.5.
I'm not aware of a comprehensive guide to project estimation for quant UX or data science ... but there are several for software engineering. And those are fine, because software engineering strongly overlaps quant UX and data science projects (see the Venn diagram here).
My favorite for software engineering is a classic: Steve McConnell's Software Estimation: Demystifying the Black Art (Amazon). McConnell presents several models, discusses key problems in detail, and addresses common organizational problems. Although the book focuses on larger projects, most of the discussion is relevant to quant projects. You learn more about time estimation as well as concepts and jargon to better understand colleagues in software engineering. It is also surprisingly readable.
Thanks for reading ... and have a good month for your next project!
Appendix: R Code for the Chart
Here is R code to make the Gantt process chart shown above for a simple project, using the critpath package. It's not terribly useful as is, but I like to share R code for my blog illustrations. It may be a useful starting point for a more complex plan.
Minor R point. This code defines the project steps using horizontal vectors for simplicity. In practice you would almost always want to define those as vertical columns (e.g., in a spreadsheet) and transpose them (perhaps with t()).
plan.dat <- data.frame(Start = c( 1, 2, 2, 3, 4, 5, 6),
End = c( 3, 3, 5, 4, 6, 7, 8),
Name = c("Planning", "POC", "Initial.Code", "Pilot.Data", "Sample", "Analysis", "Reporting"),
Duration = c( 2, 1, 3, 1, 1, 2, 2))
library(critpath)
path.solve <- solve_pathAOA(plan.dat)
plot_gantt(path.solve)