Product Interest and Engagement Scale (PIES)

When I first worked in UX for consumer electronics (CE) devices, I faced a recurring problem: what to do about the fact that some users are fans of any particular product category, while others care very little. For example, some people are keyboard enthusiasts but others are OK with almost any keyboard.
This issue showed up in multiple ways, such as:
Recruiting for UX studies: we wanted a mix of folks who were not only enthusiasts but also those who were uninterested.
Survey analytics: we needed a covariate to use in analyses (such as regression models) and make other estimates more precise (for example, to model perceived value, aka willingness-to-pay, as a function of category interest).
Building user profiles or segmentation: we wanted to have basis variables that were directly relevant to the product, to use for segmentation purposes.
In working with Ed Love (now chair of marketing & finance at Western Washington University), we found that previously published interest scales were not suitableto assess users of consumer electronics and other tech products. A typical problem was odd wording, such as asking whether a product was "relevant." Respondents thought it was bizarre to ask whether a keyboard was relevant.
So we developed and eventually published our own scale. In this post, I describe and share the "Product Interest and Engagement Scale" (PIES). In addition to Ed Love, my colleagues Michal Lahav and James Alford also contributed!
PIES Items and Scoring
I'll start with the part you probably most care about: the items. The final version of PIES has 3 subscales with 11 total items:
| Item | General scale |
| 1 | I am very interested in __ . |
| 2 | __ are not very important to me. (Reverse-scored) |
| 3 | I never think about __. (Reverse-scored) |
| Choice / Feature scale | |
| 4 | In choosing a __ I would look for some specific features or options. |
| 5 | If I chose a new __ I would investigate the available choices in depth. |
| 6 | Some __ are clearly better than others. |
| 7 | If I were choosing a __, I would wish to learn about the available options in detail. |
| Image scale | |
| 8 | When people see someone's __, they form an opinion of that person. |
| 9 | A __ expresses a lot about the person who owns it. |
| 10 | You can learn a lot about a person by seeing the person's __. |
| 11 | It is important to choose a __ that matches one's image. |
Each "__" should be replaced by the name of a general product category.
For example, you might ask "Some smartphones are clearly better than others" or "An automobile expresses a lot about the person who owns it." Adjust the grammar (singular/plural, etc.) as needed. In some cases, a brand or other descriptor may work instead of a product category.
The items are administered using a Likert-style agreement scale with consecutive numbering (e.g., 1-5). The items were developed and validated mostly using a 5-point scale with "strongly disagree", "disagree", "neutral", "agree", and "strongly agree". You can collect responses using either a grid or individual items. Randomize the item order (but don't randomize the scale direction unless you randomize it between respondents! Scales should stay consistent for any single respondent.)
IMO the details of the rating scale do not matter a lot. Instead of a 5-point scale, you could use a 7-point scale or something else. PIES was developed with both 5-point and 7-point samples (mostly 5-point). FWIW, I'm not into Likert scale "controversies," and I find that respondents can handle any reasonable scale. The UI and other decisions about a survey are far more important!
To score the items, add up the ratings — reversing scores where noted — for each of the subscales and the overall scale. PIES was explicitly designed (and validated!) to be simple, to add up as a quasi-continuous scale even if the items are technically ordinal in nature, and not to require fractional weighting of items or subscales.
Validation Research
Too often, applied researchers write items, make up a scale, and then assume it will work, with little or no research to validate it. (See this post for more.)
For PIES, we went multiple rounds of research to validate the scale for CE product categories and for other reference products (including automobiles, sandwich bread, everyday clothes, and several others).
I won't go into all of the details, but in a nutshell that involved these steps:
Assessing an initial list of 50+ items from existing literature plus newly written items.
Iterated exploratory factor analysis (EFA) and confirmatory factor analysis (CFA) to choose items that reliably associate with one another in a hierarchical factor structure. (We tested a 3-factor hierarchical model against 3-factor non-hierarchical and 1-factor alternative models.)
Validating an initial scale with 12 items, which we called PIES-beta.
Revising it after several rounds of applied usage; then EFA to develop and CFA to validate a final11 item version, as presented above.
In the validation research, we collected baseline stats for 13 product categories from adult respondents in the US. The results are somewhat dated now (this was in ~2011) but they are still informative and speak to how well the scale works. Here they are:
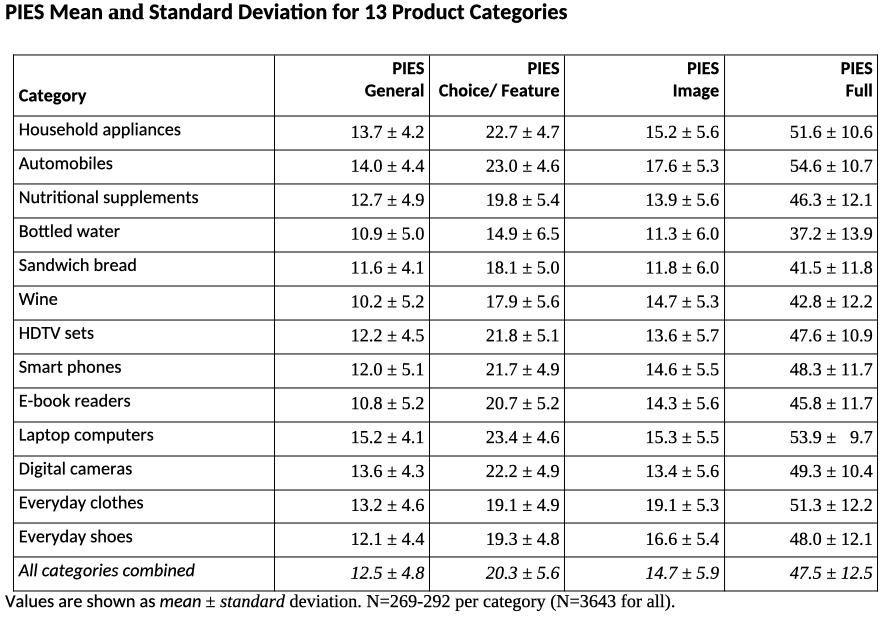
These norms show, for example, that respondents are far more interested in some categories than others (for instance, automobiles and laptops vs. bottled water and wine). Some categories are more about the features (cameras, appliances) whereas others are about personal image (clothes, shoes) and some are about both (automobiles, laptops).
And the categories differ in sample variance, i.e., whether people show lower differences from one another (laptops) or greater diversity in their level of interest (bottled water, wine). All of these results align with expectation about the categories as well as showing strong results in CFA analysis (see the references for more).
We also normed the scale on additional CE product categories that I'm not able to share because they were job-specific, as opposed to the general results above. For more on the validation steps and models, see the references at the end of this post.
Using PIES in Applied Research
The entire PIES scale is compact, compared to many scales, although 11 items is still a lot of items. I always advocate for asking as few items as possible!
Depending on the situation, you might decide use a portion of PIES, such as:
Use 1 subscale of interest (3 or 4 items)
Select 1 item from each scale, and add them up for an overall score (3 items)
Select 2 items from each subscale to reduce the length (6 items)
I won't go into specific recommendations for item subsets because (a) it depends, and (b) the items are sufficiently robust that you shouldn't go far wrong ... except to say that if you want to obtain and use subscale scores, you should ask at least 2 items per subscale.
I find PIES to be especially useful for:
Recruiting a desired sample according to product interest (either high interest, low, or mixed)
Understanding how users' perceptions your category. For instance, is our product an "image" product or not? In this case, collecting some benchmark reference data can be helpful! You might ask: is our product more or less interesting than sandwich bread, or automobiles?
Segmenting users on something that is closely product-related. (I don't like demographic segmentation; that's a separate discussion!)
Using it as a covariate in regression models to get a better signal from other metrics.
What About Intention to Purchase or Willingness to Pay?
PIES is about interest in a category and the type of interest (detailed choices vs. personal image). Whether a consumer will purchase a product is a separate question. Consumers often purchase things they are not interested in; and even highly interested customers can't purchase everything.
Interest and purchase intent are correlated — we might expect interest to be partially associated with somewhat higher likelihood to purchase — but are not identical. They are also assessed differently on surveys.
To assess feature preference, intention to purchase product, and price sensitivity, I most often recommend choice-based conjoint analysis. Conjoint analysis simulates a competitive purchasing process while randomizing products' features and prices. That's a topic for another post! (Or see Chapter 13 in the R book.)
In practice, a research project might combine them. I often use PIES to assess respondents' level of interest in a product, and then examine how that is associated with conjoint analysis results for preferences of features, brands, or price points.
Want to Use PIES?
Go ahead! It is a published scale. However, the coauthors and I would be happy if you add a citation of some sort, such as any one (or more) of these:
[preferred] CN Chapman, M Lahav, E Love, and JL Alford (2009). Product Interest and Engagement Scale, Beta (PIES-beta). In Proceedings of CHI 2009, Boston, MA.
CN Chapman, EM Feit (2019). Chapter 10 of R for Marketing Research and Analytics(2nd ed). New York: Springer.
CN Chapman (2024). Product Interest and Engagement Scale (PIES). At: The Quant UX Blog, https://quantuxblog.com
If you use PIES, I'd be interested to hear about your project and the experience.
Learning More
Here are a few pointers to additional reading.
First, if you're interested to use PIES and you want to understand more about it and how it was validated, see the first two references above (here and here). In particular, the R book explains the EFA and CFA methods used to develop and validate it.
However, you don't really need to understand those methods to use PIES. Just follow the instructions above.
Second, if you're interested to develop a similar scale on your own ... well, you're asking to dive into psychometrics! If that's new to you, I'd recommend instead to go looking for validated scales you could use. But if you go ahead, you'll want to learn about exploratory and confirmatory factor analysis (EFA and CFA).
As I noted above, too many survey practitioners simply make up items and scales, and then assume that they will work as intended. It is unlikely that untested items will work as expected. In the process of developing PIES, we tested and mostly discarded more than 70 items and versions of items. We discarded most of them not because the items were bad, but because they were not reliable or stable for many different reasons, or did not cleanly load onto useful factors (subscales).
BTW, this applies to screener items, too! Without assessment, screener items are more likely to introduce unknown biases than to work as intended. (That's another discussion!)
If you decide to develop a scale of your own, for any purpose, the process should include a few rounds of testing and analysis, especially EFA and (perhaps) CFA. An outstanding general introduction to the topic is DeVellis and Thorpe's Scale Development.
Then, to move into details of the analysis, Chapters 8 and 10 in the R book cover EFA and CFA, respectively. A free online book about psychometrics in R is Brown, Psychometrics in Exercises Using R and RStudio. That book is an excellent "next read" after the previously mentioned two chapters of the R book.
Kline's Principles and Practice of Structural Equation Modeling is a thorough review of SEM, but much broader than scale development. It could follow after reading about SEM in the R Book and then Brown's Psychometrics.
Cheers, and I hope PIES will be useful to you!